
Introduction
Cloudwatch is an integral part of the AWS ecosystem. Every service in AWS reports to cloudwatch for the service logs, application logs, metrics, etc.
In this article let’s discuss the cloudwatch custom metrics in detail.
Metrics help us with finding the performance of the AWS services and the applications we run using these services. It also allows us to visualize the data with graphs and dashboards and create alarms based on the data reported tho metrics. If you are new to cloudwatch and cloudwatch metrics you can learn the basic concepts here
Custom Metrics
By default, AWS provides free metrics for most of its services. Apart from its own service metrics, AWS allows us to publish custom metrics, which means we can send our application-specific metrics to cloudwatch metrics. for example, we can push the metrics for the duration of third-party api calls, or the count of status codes returned by an API, etc. Then we can create alarms, dashboards based on those metrics.
Now let’s see how we can create custom metrics and put data points to them, There are three ways of creating custom cloudwatch metrics from your application.
- AWS API’s/SDK for cloudwatch metric
- Metric Log Filters
- Cloudwatch Embedded Metric Format
Let’s see how we can create Custom metrics with the above three methods. For the demo purpose, let’s assume we have an AWS lambda function that calls a weather API, and we want to create metrics around the API call duration and the count of status codes returned by the API endpoint.
AWS API’s/SDK’s
This method uses the AWS cloudwatch metrics SDK’s putMetricData API to create the custom metrics. This method is pretty straightforward, but the problem with this method is that it will incur an additional API call and it can block other API calls in your application while putting metrics to cloudwatch. This could affect the latency of your application (for eg: REST APIs). Also, each putMetricData api call involves cost. AWS will charge $0.01 per 1000 requests.
Example
'use strict';

const axios = require('axios')
const AWS = require('aws-sdk')
const cloudwatch = new AWS.CloudWatch();


module.exports.handler = async (event) => {
  try {

    const startTime = new Date()
    const response = await axios.get('https://www.metaweather.com/api/location/2487956/2021/8/8')
    const apiStatusCode = response.status
    const endTime = new Date()

    console.log(apiStatusCode)

    const apiCallDuration = endTime - startTime

    const statusMetricParams = {
        MetricData: [
          {
            MetricName: 'status_code',
            Dimensions: [
              {
                Name: 'status_code',
                Value: `http_${apiStatusCode}`
              },
            ],
            Timestamp: new Date(),
            Unit: 'Count',
            Value: 1,
          }
        ],
        Namespace: 'MetricFromSDK_1'
    };

    await cloudwatch.putMetricData(statusMetricParams).promise();

    const durationMetricParams = {
        MetricData: [
            {
                MetricName: 'api_call_duration',
                Dimensions: [
                    {
                    Name: 'api_name',
                    Value: `location_api`
                    },
                ],
                Timestamp: new Date(),
                Unit: 'Milliseconds',
                Value: apiCallDuration,
            }
        ],
        Namespace: 'MetricFromSDK_1'
    };

    await cloudwatch.putMetricData(durationMetricParams).promise();

  } catch (error) {
    console.error('failed',error)
  }
};
Metric Log Filters
Metric log filters can search and filter data points needed to create metrics from Cloudwatch log groups. CloudWatch Logs uses these metric filters to turn log data into numerical CloudWatch metrics that you can graph or set an alarm on. When you create a metric from a log filter, you can also choose to assign dimensions and a unit to the metric. If you specify a unit, be sure to specify the correct one when you create the filter. Changing the unit for the filter later will have no effect.
With this method, the metrics are generated asynchronously. You don’t need any additional API calls from the application to generate the metrics. You just need to log the metrics data in a JSON format in the application and create a metric filter for each metric on the applications cloudwatch log group which filters the metric data from the logs based on the filter expressions defined.
The only downside I see with this method is the creation of metric filters on log groups every time you need to create a new metric. You can create them manually or use any IaC tool to generate them on demand.
Example
'use strict';

const axios = require('axios')

module.exports.handler = async (event) => {
  try {

    const startTime = new Date()
    const response = await axios.get('https://www.metaweather.com/api/location/2487956/2021/8/8')
    const apiStatusCode = response.status
    const endTime = new Date()

    const apiCallDuration = endTime - startTime

    console.log({ metricName: 'api_call_duration', metricValue: apiCallDuration })
    console.log({ metricName: 'status_code_count', metricValue: apiStatusCode})

    console.log({[`http_${apiStatusCode}`]: 1})

  } catch (error) {
    console.error(error)
  }
};
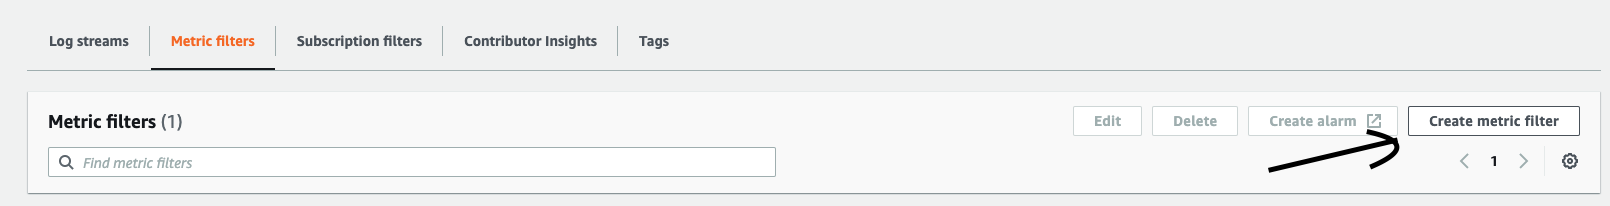
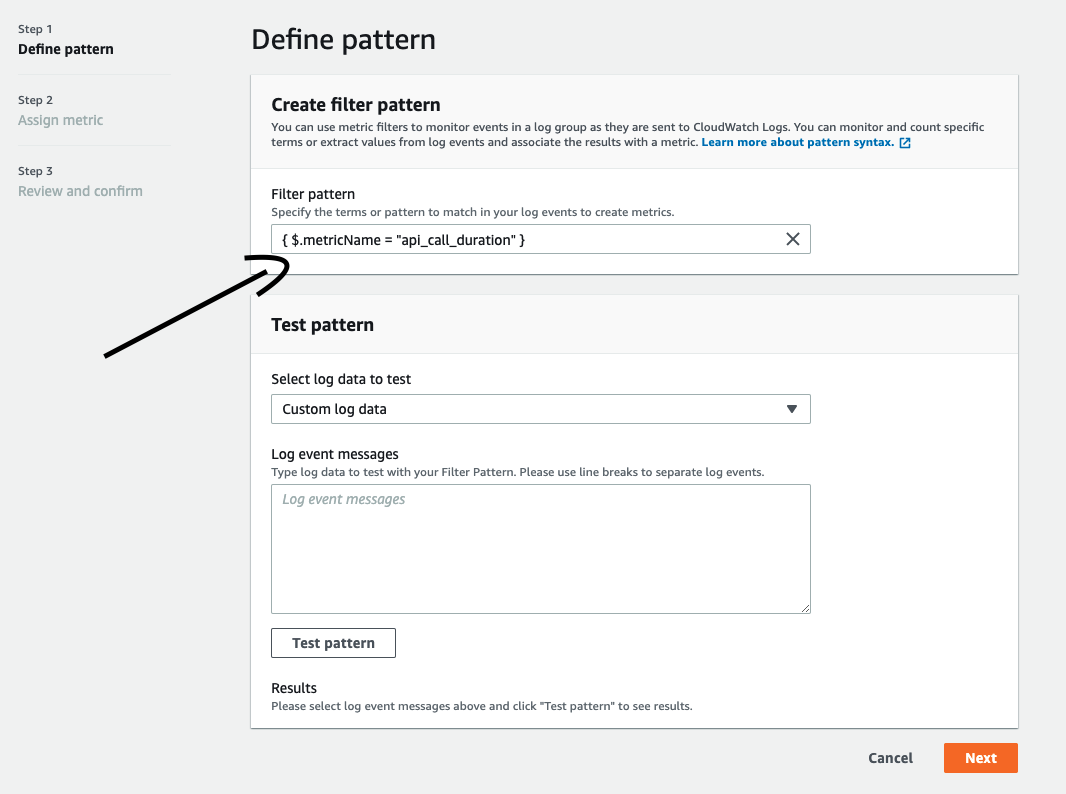
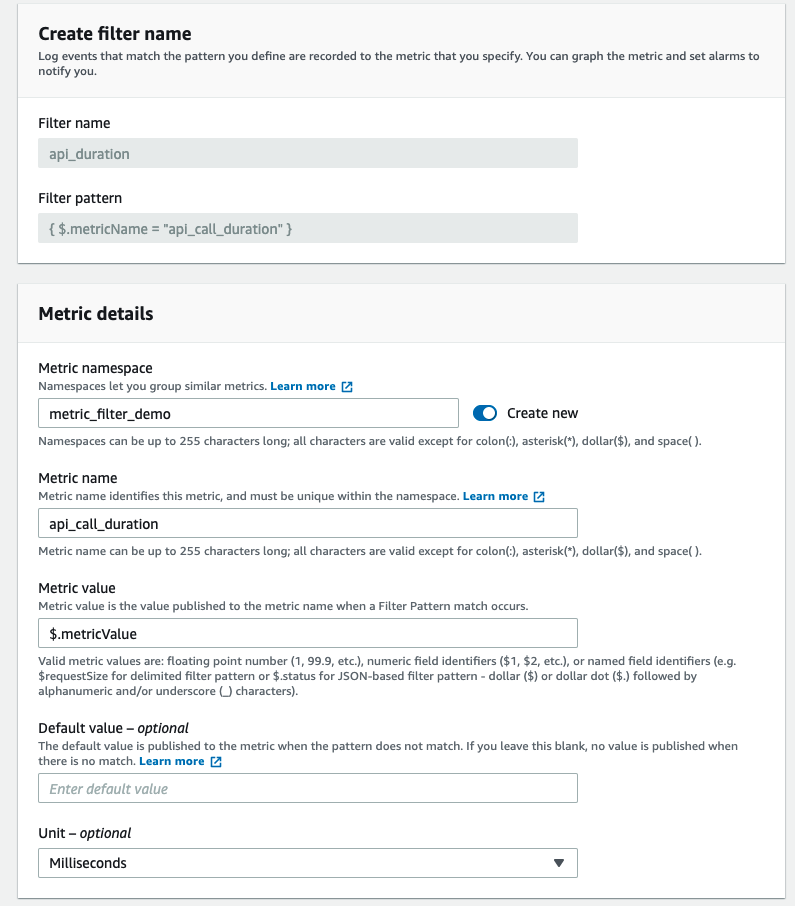
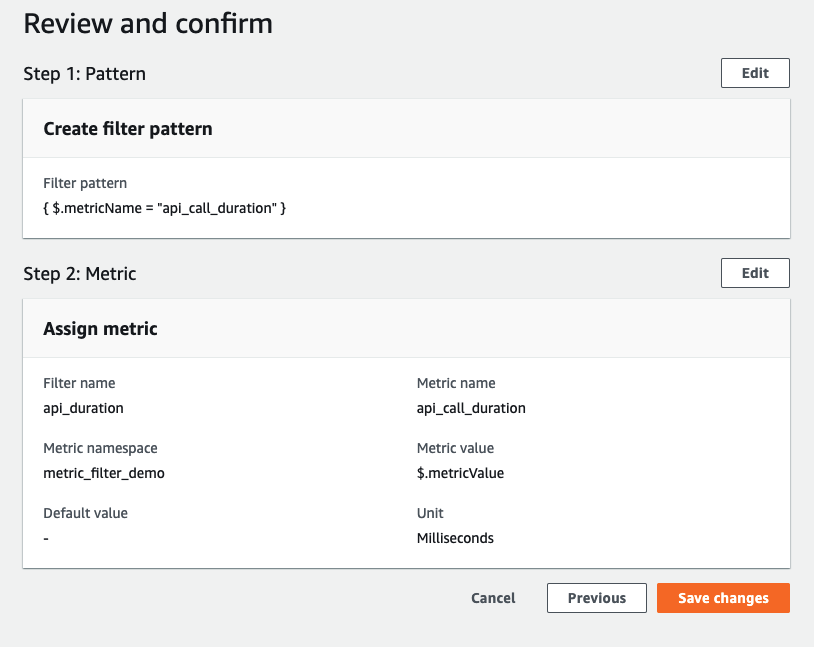
Once the logs are pushed to cloudwatch logs, the next step is to create a metric filter on the log from which we want to filter the data points to generate the metric.
Follow the below screenshots to see how to create a metric filter based on the logs that we generate from the code. Once the metric filter is created properly and the filter patterns match with the logs it will create a metric and start pushing data points to it on every new log.
Cloudwatch Embedded Metric Format
The CloudWatch embedded metric format is a JSON specification used to instruct CloudWatch Logs to automatically extract metric values embedded in structured log events. You can use CloudWatch to graph and create alarms on the extracted metric values.
This is my personal favorite method. This is an asynchronous process, which means it does not make any API call to generate metrics, and no metric filters are needed. All you have to do is log your metrics to cloudwatch in a specific JSON format as documented here. AWS will automatically parse these logs from cloudwatch log groups and generate the metrics for you.
There are two ways to use this method,
- Directly log the metrics in JSON format as documented here
- Using embedded metric NPM module from AWS (Examples available at the modules GitHub page here)
Below is an example of the first method.
'use strict';

const axios = require('axios')

module.exports.handler = async (event) => {
  try {

    const startTime = new Date()
    const response = await axios.get('https://www.metaweather.com/api/location/2487956/2021/8/')
    const apiStatusCode = response.status
    const endTime = new Date()

    console.log(apiStatusCode)

    const apiCallDuration = endTime - startTime

    // Create Metric For Status Code Count
    console.log(
      JSON.stringify({
        message: '[Embedded Metric]', // Identifier for metric logs in CW logs
        status_code_count: 1, // Metric Name and value
        status_code: `http_${apiStatusCode}`, // Diamension name and value
        _aws: {
          Timestamp: Date.now(),
          CloudWatchMetrics: [
            {
              Namespace: `demo_2`,
              Dimensions: [['status_code']],
              Metrics: [
                {
                  Name: 'status_code_count',
                  Unit: 'Count',
                },
              ],
            },
          ],
        },
      })
    )

    // Create Metric For API Call Duration
    console.log(
      JSON.stringify({
        message: '[Embedded Metric]', // Identifier for metric logs in CW logs
        api_call_duration: apiCallDuration, // Metric Name and value
        api_name: 'location_api', // Diamension name and value
        _aws: {
          Timestamp: Date.now(),
          CloudWatchMetrics: [
            {
              Namespace: `demo_2`,
              Dimensions: [['api_name']],
              Metrics: [
                {
                  Name: 'api_call_duration',
                  Unit: 'Milliseconds',
                },
              ],
            },
          ],
        },
      })
    )

  } catch (error) {
    console.error(error)
  }
};
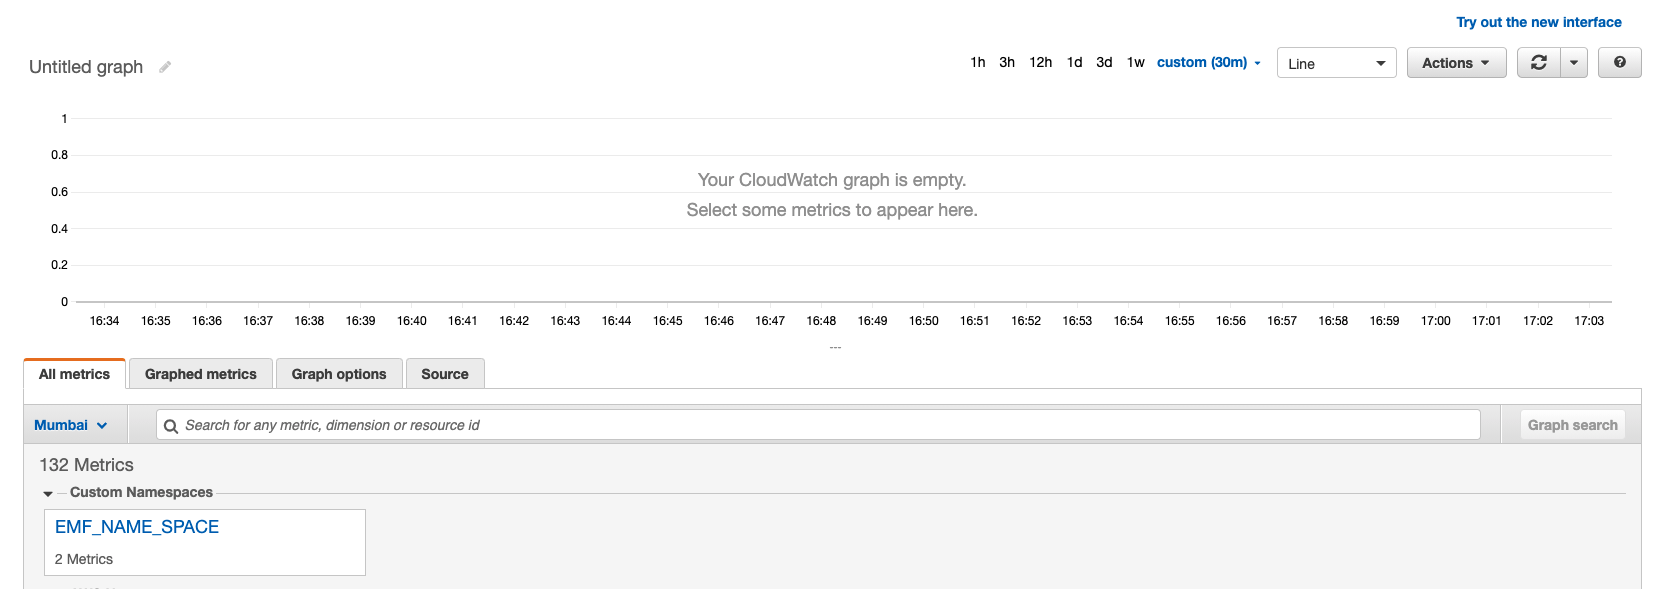
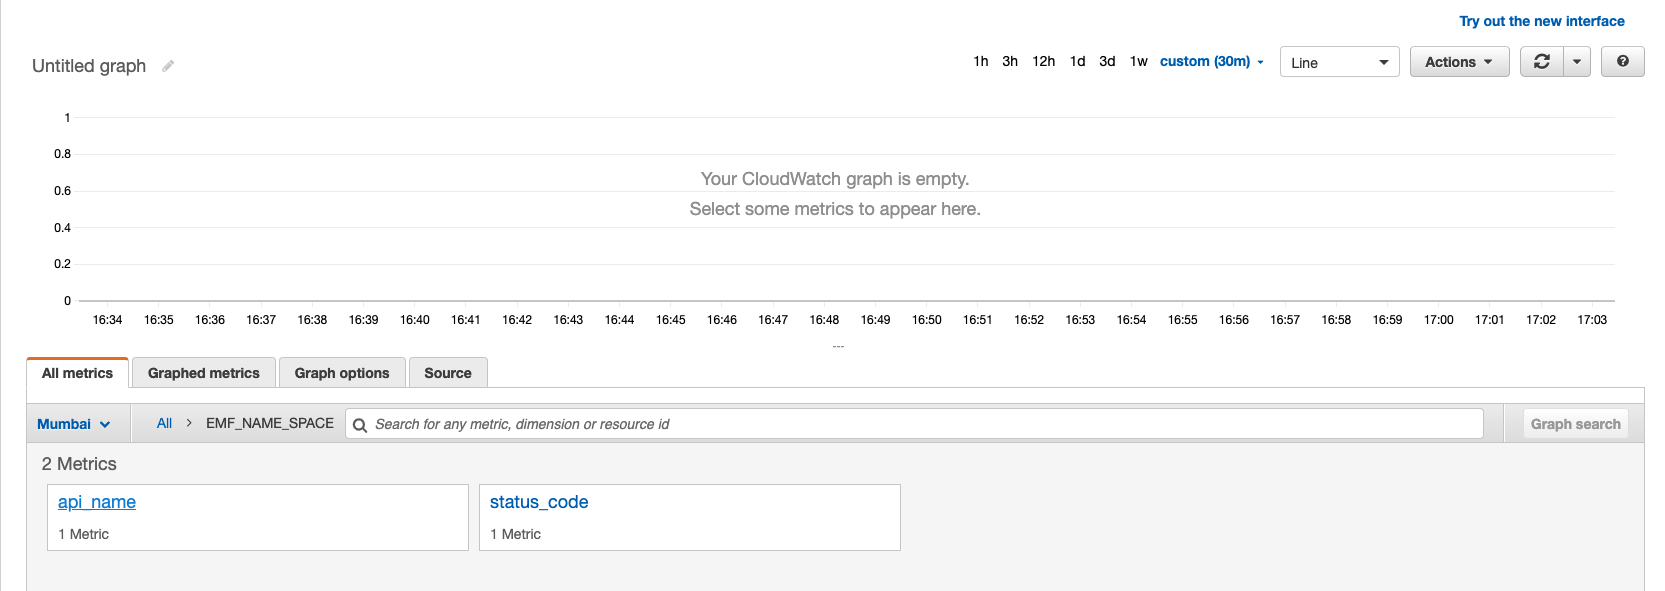
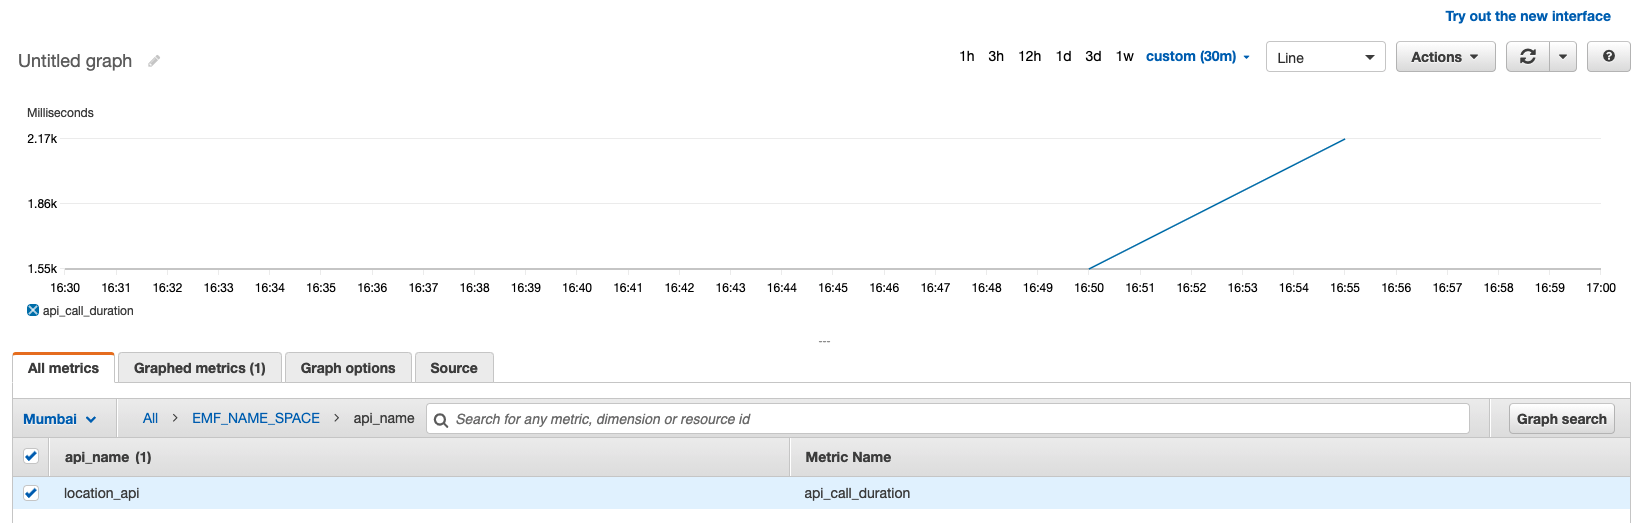
Below are the screenshots of the custom metrics we created with the above methods,
Name Space
Dimension
Metric
Conclusion
We have discussed three methods above, First one is synchronous and the other two are asynchronous. I personally prefer the asynchronous method because the metric generation process will not block the other API calls in the application.
Cloudwatch custom metrics can be used in the following scenarios,
- Third-Party integration metrics(API call duration, success or failed count of processes, etc)
- Custom metrics around events/processes in the application